The Hubverse: Streamlining Collaborative Infectious Disease Modeling

RSECon26 · Sheffield

9 September 2026

hubverse hex logo QR code linking to these slides at https://hubverse-org.github.io/hubverse-talk-RSECon26

Background

❌ Where we started

Infectious disease modeling scaled rapidly through COVID-19…

  • …but early on the landscape was fragmented:
    • Each group used its own data structures
    • Results were hard to integrate or compare
    • Modelers and decision-makers not always aligned

“Comparing the accuracy of forecasting applications is difficult because forecasting methods, forecast outcomes, and reported validation metrics varied widely.”

✨ The promise of modeling hubs

Modeling hubs coordinate collaborative forecasting:

  • Provide centralised location for effort coordination

  • Define data standards and modeling targets

  • Improve transparency and comparability

  • Aggregate forecasts enabling ensembles

  • Facilitate timely public health decision-making


“Collaborative Hubs: Making the Most of Predictive Epidemic Modeling”, American Journal of Public Health Reich, et al. 2022

🕰️ Project origins

  • Pre-COVID: Forecasting code base existed for CDC influenza hubs
  • During COVID: That code was reused for new COVID-19 hubs + demand internationally (e.g. Europe) for similar setups
  • ❗ Problem: Each hub required manual editing of source code
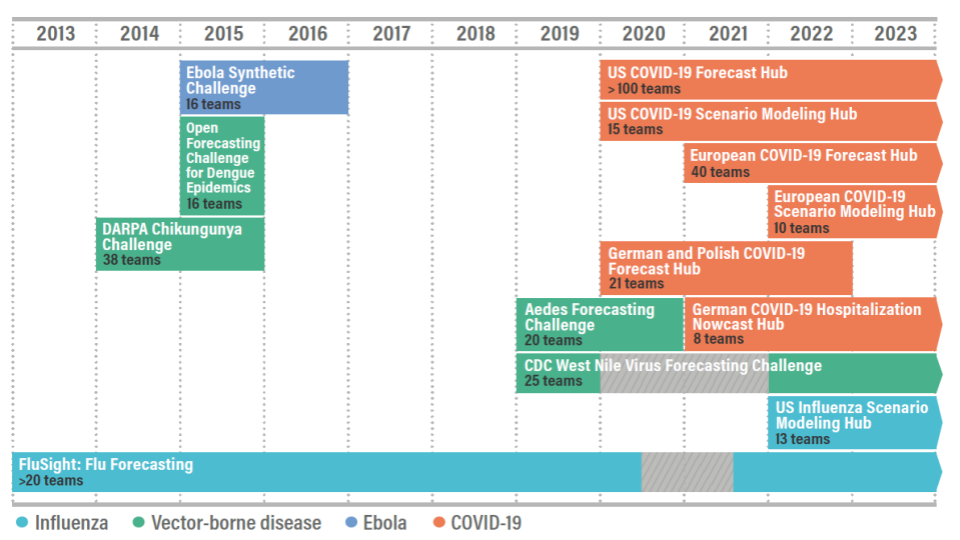
Timeline of forecasting hub development

Figure credits: Alex Vespignani and Nicole Samay

🌐 Enter the hubverse

An open-source software ecosystem to power modeling hubs:

  • GitHub repositories for centralising hub activity
  • Data standards for infectious disease modeling data
  • Schema-driven configuration for modeling tasks + hub setup
  • Modular tools for hub administration, data validation, access, evaluation, ensembling and communication

📄 A software platform for collaborative infectious disease modelling (2026), Nature Health, Consortium of Infectious Disease Modeling Hubs et al. https://doi.org/10.1038/s44360-026-00145-7

Anatomy of a hub

🏗️ What a hub actually is

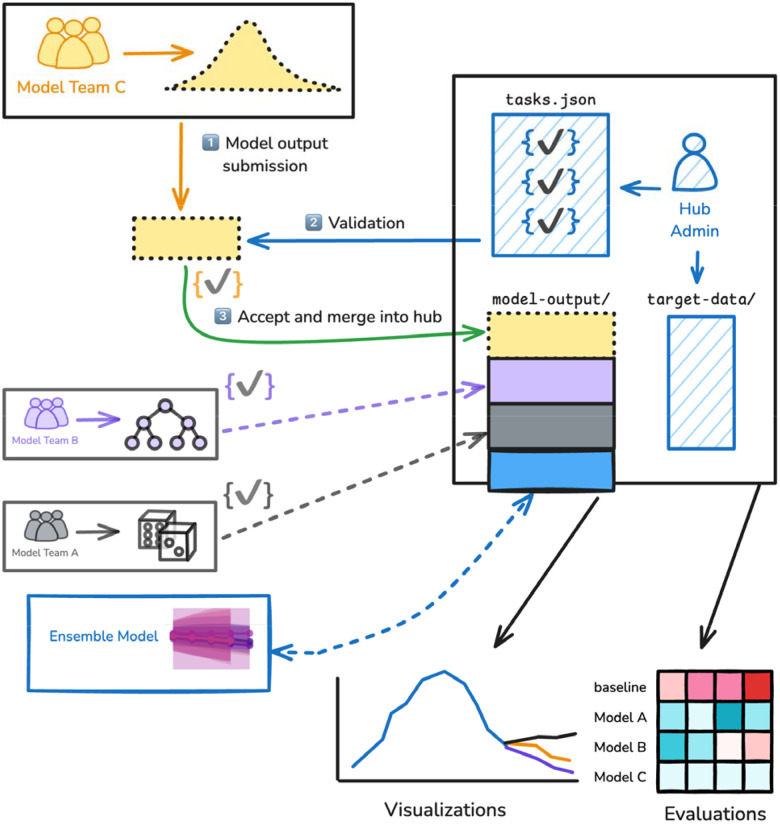
Diagram of hub architecture: model teams submit model output, which is validated against tasks.json and merged into the model-output directory alongside target data, then flows into ensembles, visualizations and evaluations.

  1. Modeling teams submit model output
  2. Submissions validated against tasks.json
  3. Accepted output merged into the hub

Everything downstream, ensembles, visualisations, evaluations, comes for free once the data are standardised.

Figure 1 from the hubverse paper (preprint, CC BY 4.0)

☑️ A shared data standard

Modeling hubs are built around a shared data standard:

  • Structured hub layout: consistent file system for organizing hub materials
  • Standard model output format: for file content and naming
  • Modeling task definition: what’s predicted, by when, for where, in what form

✅ Enable comparability, validation and integration

FluSight-forecast-hub/
├── hub-config/
│   ├── admin.json
│   ├── tasks.json
│   ├── model-metadata-schema.json
│   └── target-data.json
├── model-output/
│   └── <model_id>/
│       └── <round_id>-<model_id>.csv
├── model-metadata/
│   └── <model_id>.yml
└── target-data/

🦠 Meet the hub: CDC FluSight

The hub we’ll follow: CDC FluSight

https://github.com/cdcepi/FluSight-forecast-hub
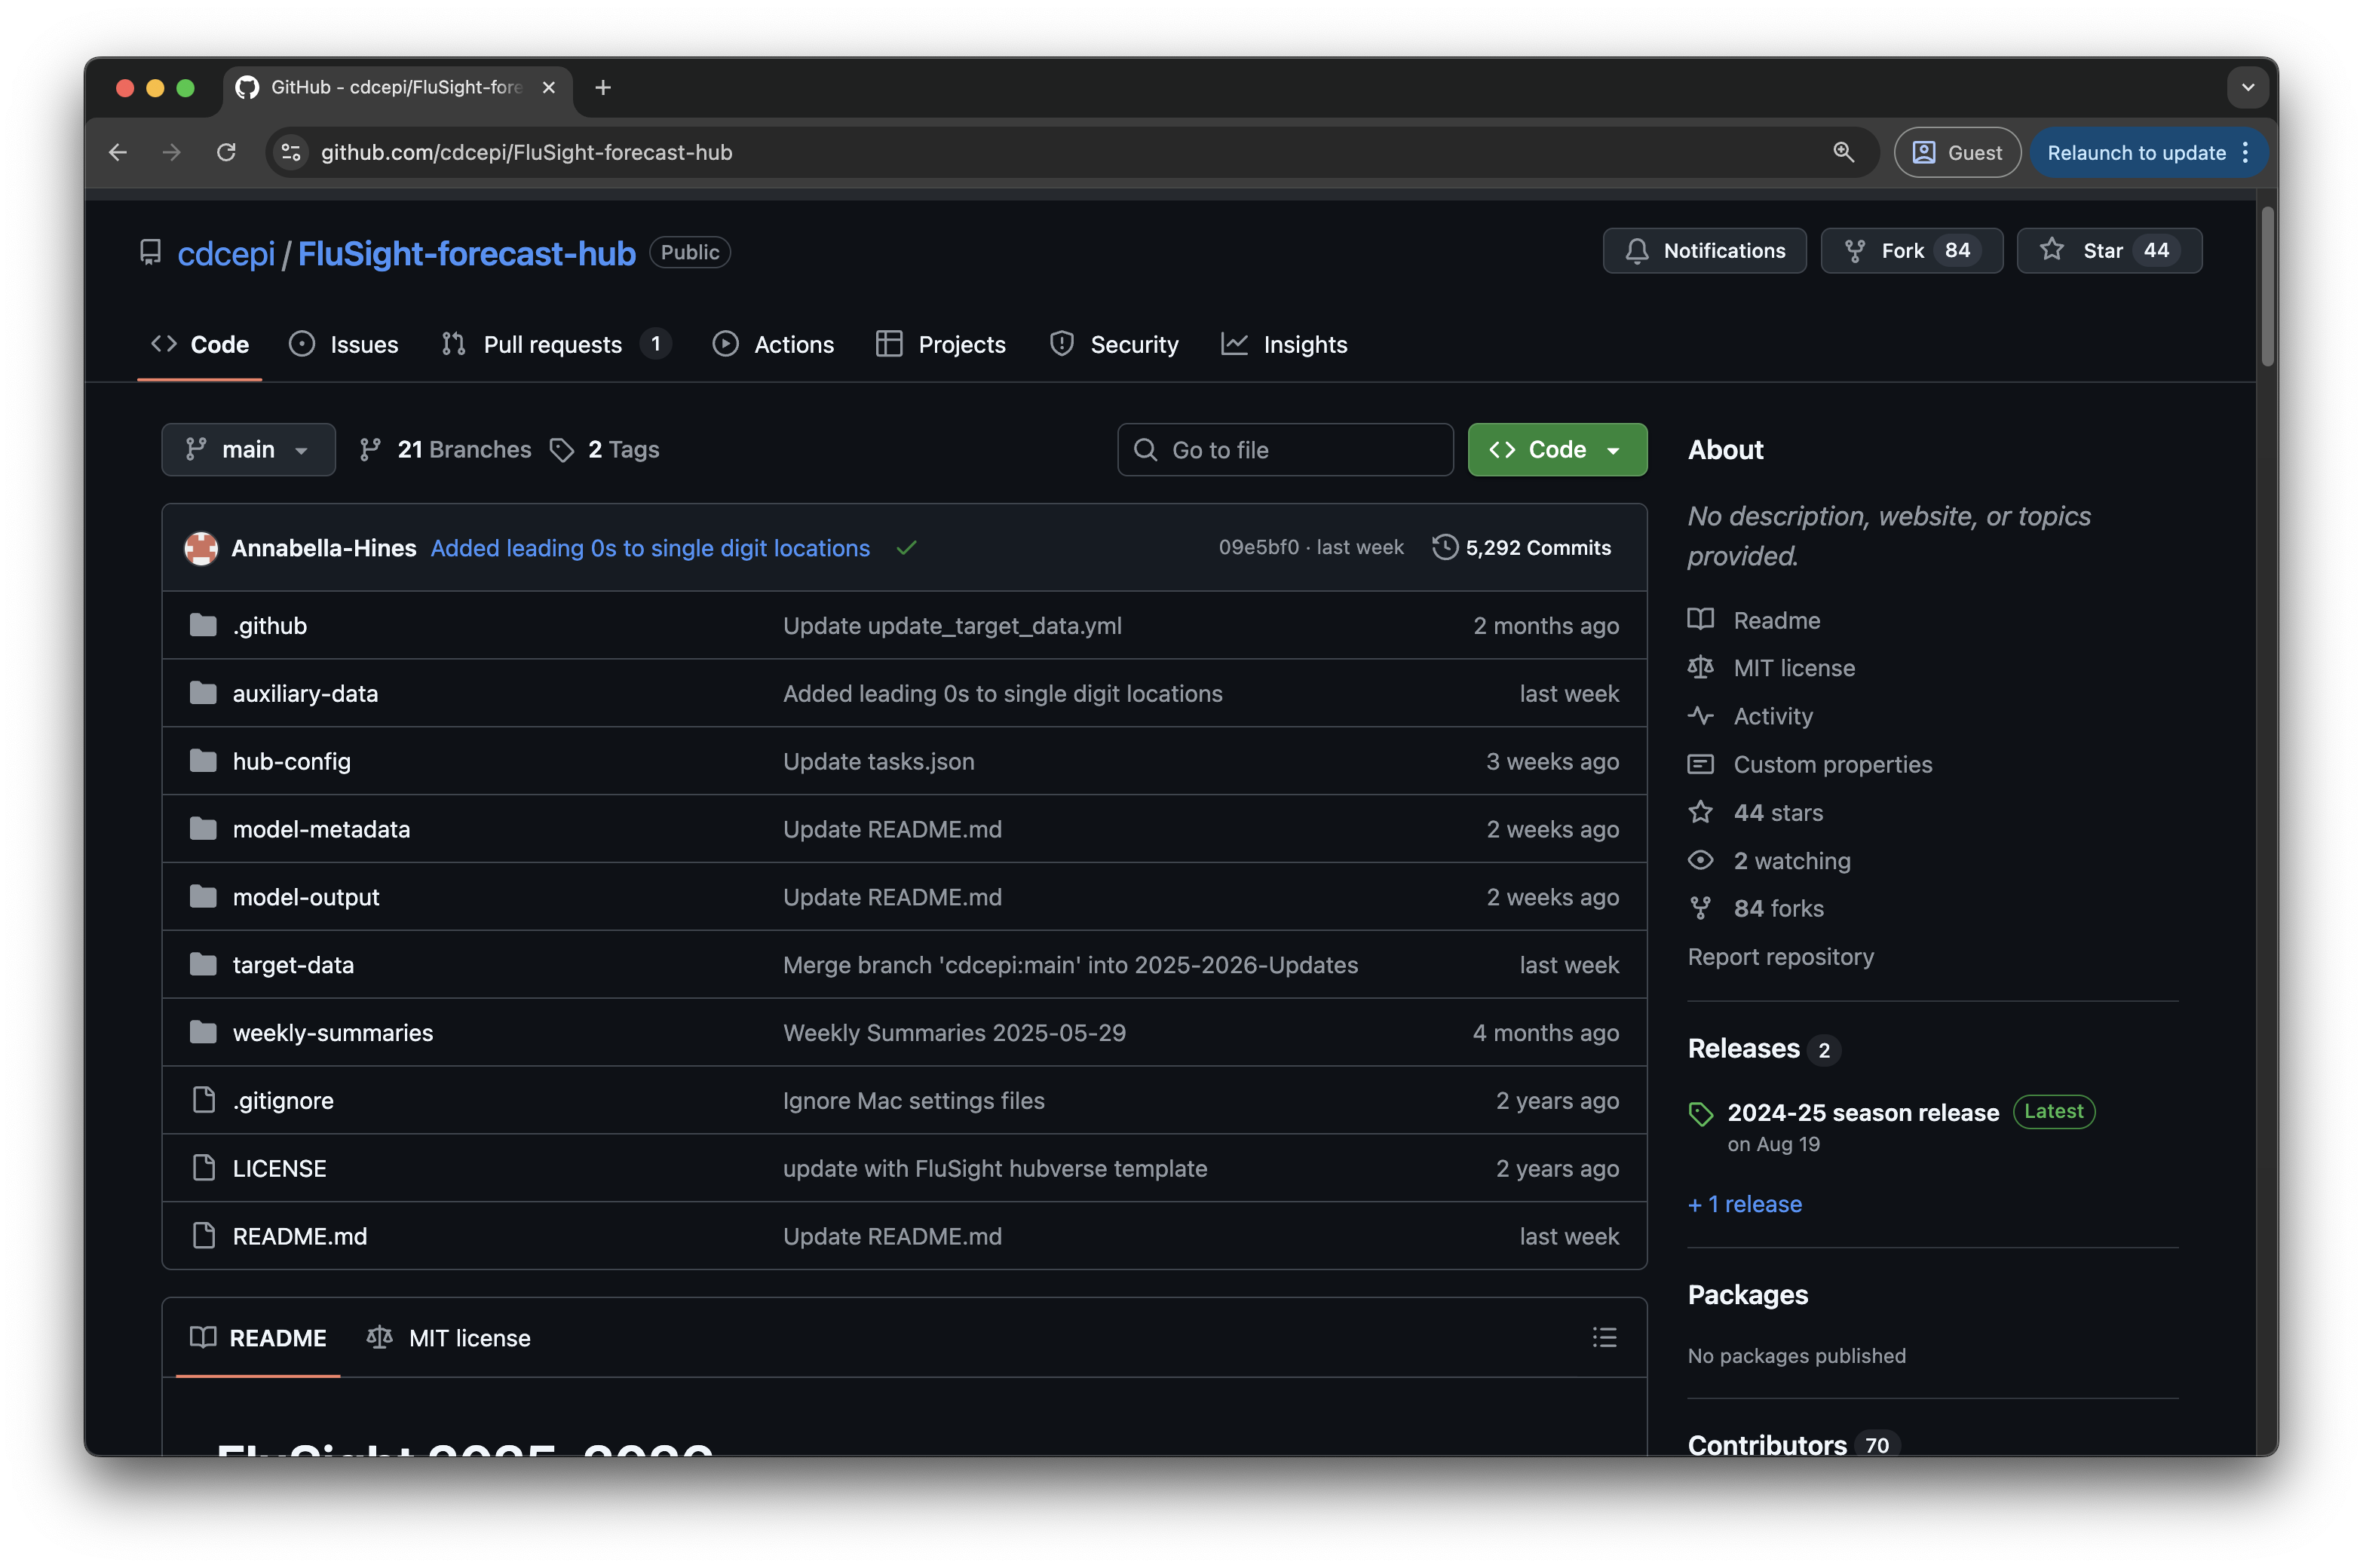
Screenshot of the CDC FluSight hub GitHub repository

  • Used by US CDC to monitor influenza severity
  • In season, ~60 models from ~30 teams, every single week
  • Managed with the full hubverse stack since 2023/24
  • 95 models from 47 teams across 88 rounds since 2023
  • Hosted on GitHub + S3 cloud mirror

US CDC logo

📁 Where model output lives

model-output/<model_id>/<round_id>-<model_id>.csv · one directory per model, one file per round
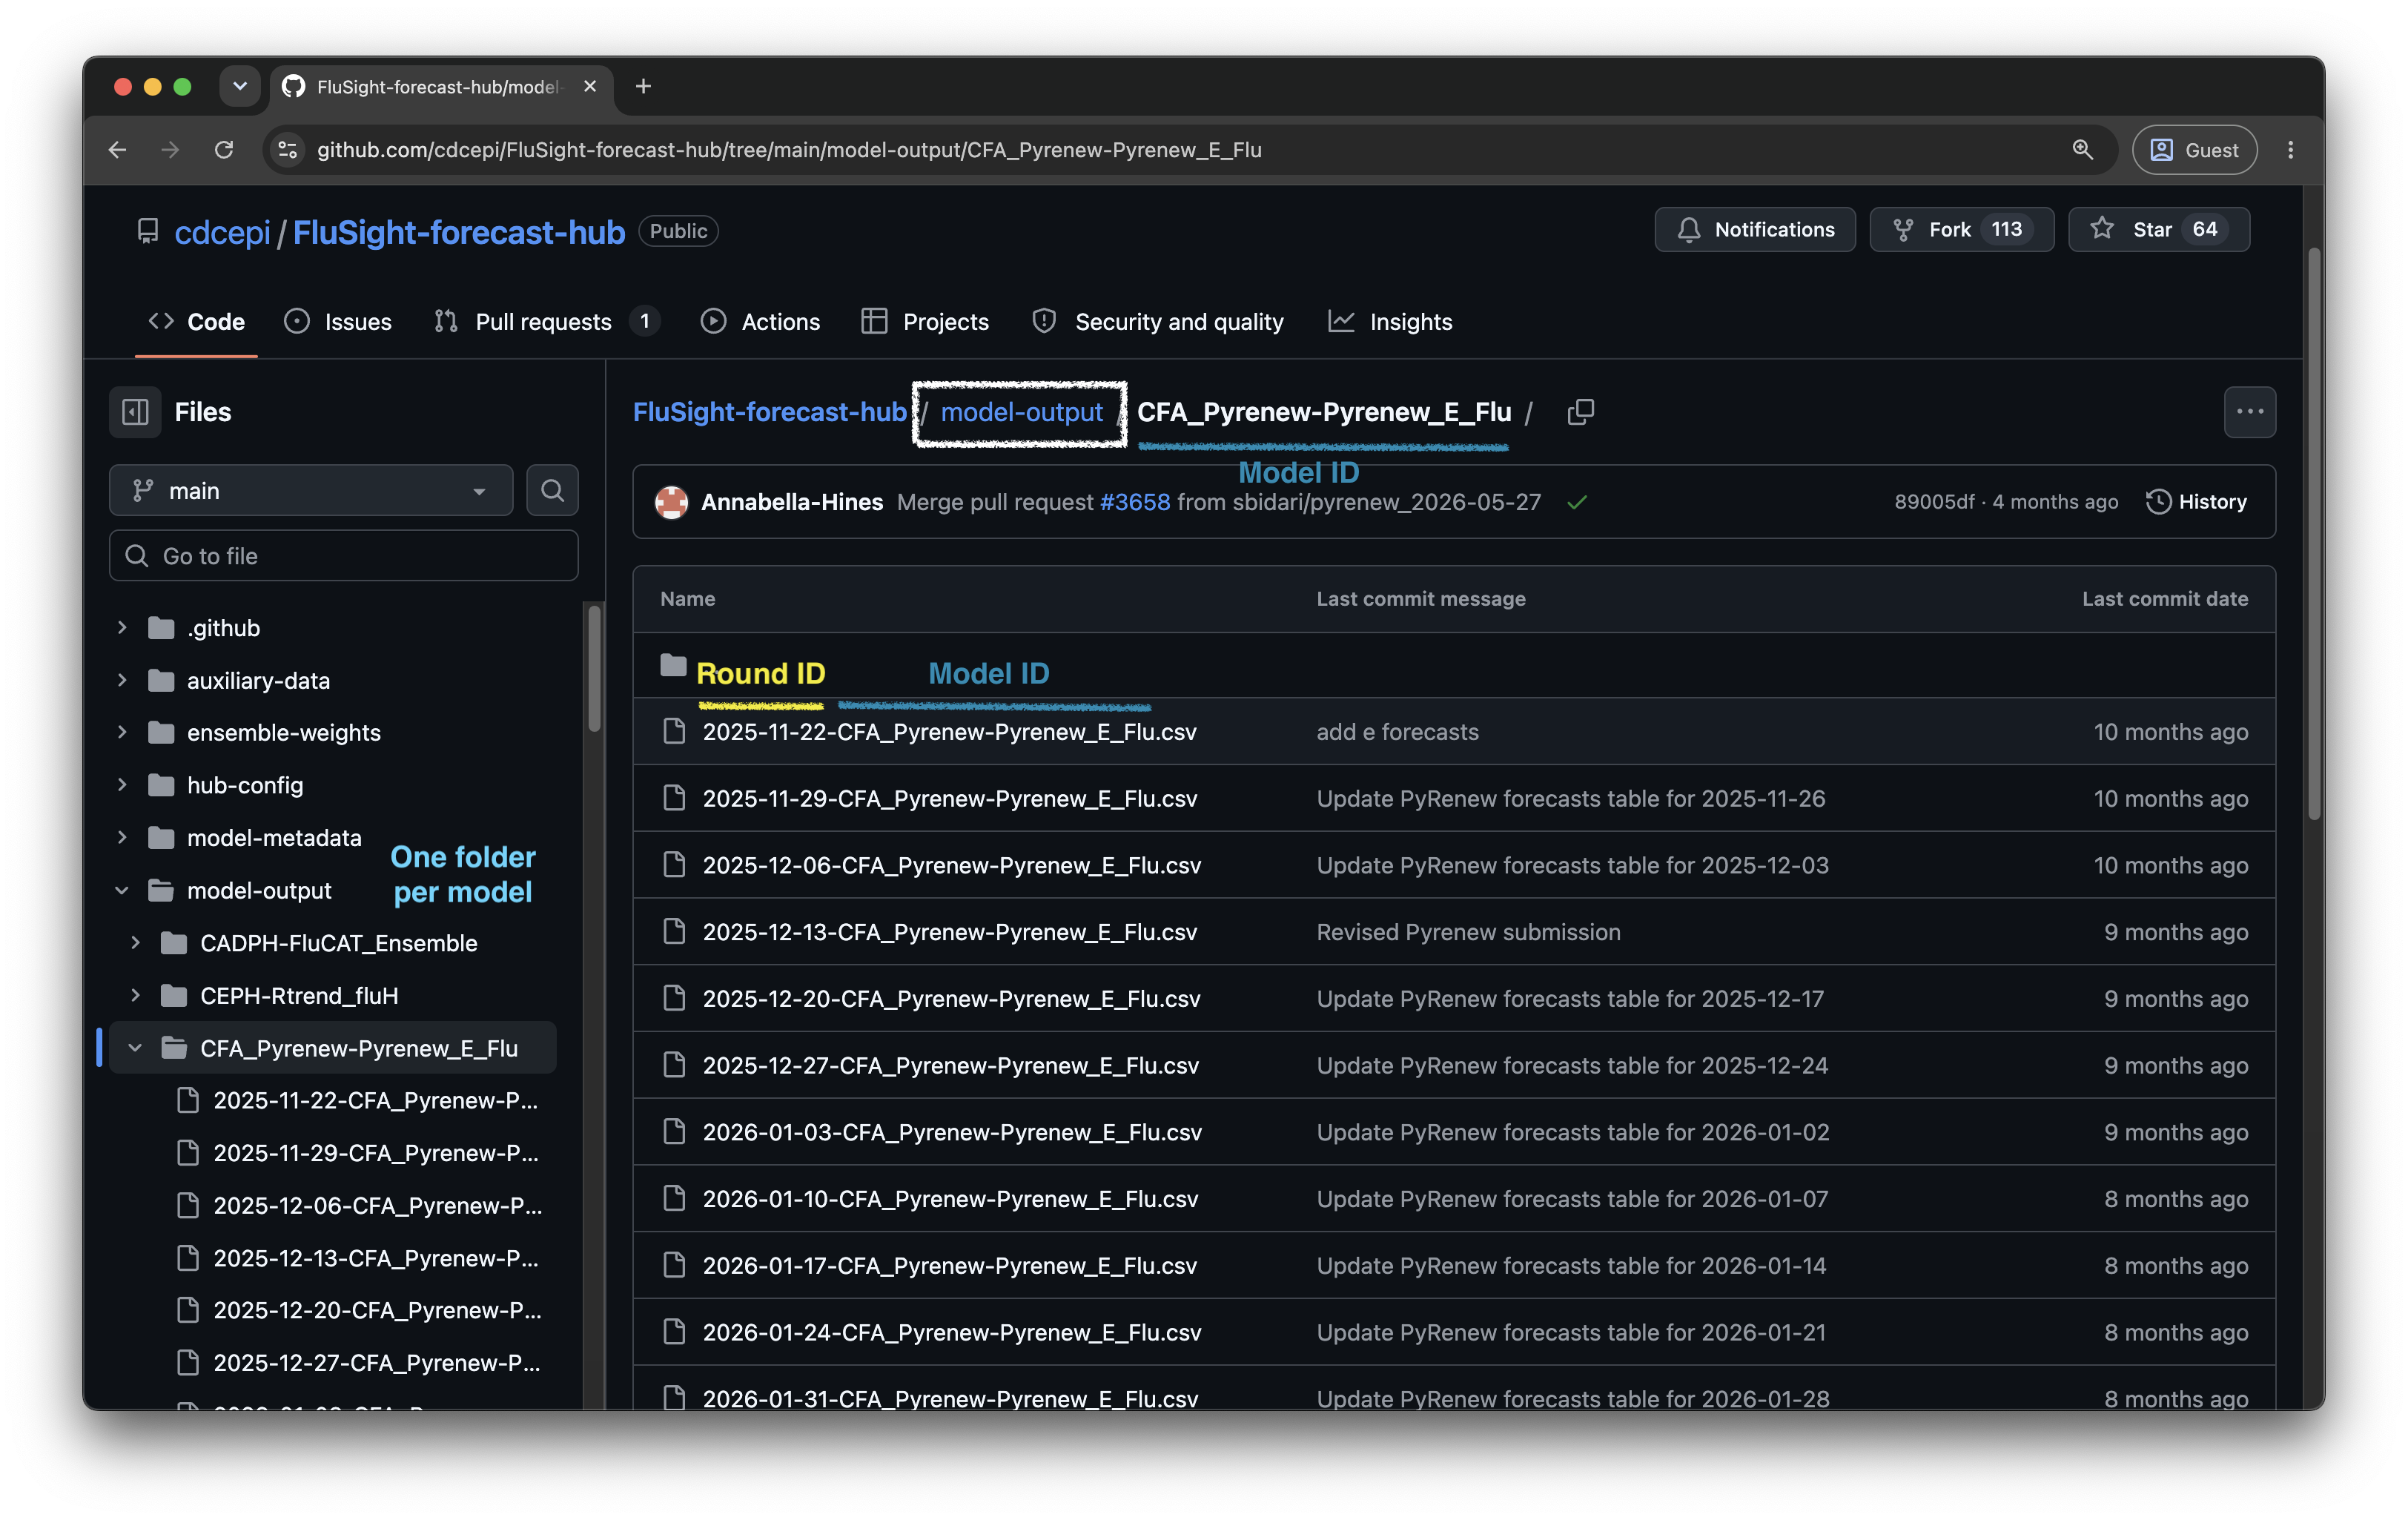
Screenshot of the FluSight hub model-output directory on GitHub, showing one folder per model and weekly files named by round ID and model ID

Configuring FluSight

⚙️ Config-driven hub setup

Hub administrators configure hubs with structured JSON config files:

  • admin.json: hub-level metadata
  • tasks.json: the scientific question: what to predict, when, and how
  • model-metadata-schema.json: what modelers must tell you about their model
  • target-data.json: what observed data should look like

All validated against a versioned JSON schema. The config is the contract between administrators, modelers and tooling.

🗂️ admin.json: the hub’s identity card

{
  "schema_version": ".../schemas/main/v6.0.0/admin-schema.json",
  "name": "US CDC FluSight",
  "maintainer": "US CDC",
  "contact": {
    "name": "Rebecca Borchering",
    "email": "xhq2@cdc.gov"
  },
  "repository": {
    "host": "github",
    "owner": "cdcepi",
    "name": "FluSight-forecast-hub"
  },
  "file_format": ["csv", "parquet"],
  "timezone": "US/Eastern",
  "cloud": {
    "enabled": true,
    "host": {
      "name": "aws",
      "storage_service": "s3",
      "storage_location": "cdcepi-flusight-forecast-hub"
    }
  }
}

🎯 Inside tasks.json

tasks.json
└── rounds[]                                   # a submission cycle
    ├── round_id_from_variable: true           # round IDs live in the data...
    ├── round_id: "reference_date"             # ...in this task ID
    ├── submissions_due                        # window, relative to the round
    └── model_tasks[]                          # groups of related predictions
        ├── task_ids{}                         # the DIMENSIONS of a prediction
        ├── output_type{}                      # the FORM the prediction takes
        └── target_metadata[]                  # what the target means

A hub can have many rounds, each with many model tasks, so a single hub can ask for several different kinds of prediction at once.

🏷️ Task IDs: the dimensions of a prediction

"task_ids": {
  "reference_date": {
    "required": null,
    "optional": ["2023-10-07", "2023-10-14", "..."]
  },
  "target": {
    "required": null,
    "optional": ["wk inc flu hosp"]
  },
  "horizon": {
    "required": null,
    "optional": [-1, 0, 1, 2, 3]
  },
  "location": {
    "required": null,
    "optional": ["US", "01", "02", "..."]
  },
  "target_end_date": {
    "required": null,
    "optional": ["2023-09-23", "2023-09-30", "..."]
  }
}

reference_date + horizon × 1 week = target_end_date

🎯 Targets carry more than a name

target is a special task ID: every value in the column gets its own metadata entry

"target_metadata": [{
  "target_id": "wk inc flu hosp",
  "target_name": "incident influenza
     hospitalizations",
  "description": "Count of new hospital
     admissions in the week ending...",
  "target_units": "count",
  "is_step_ahead": true,
  "time_unit": "week",
  "target_type": "continuous"
}]

Descriptive

  • target_name, description: for humans, and for axis labels

Quantitative

  • target_units: what is being counted
  • is_step_ahead, time_unit: one step in a sequence
  • target_type: its statistical type (continuous, ordinal, date, …)

target_type constrains how a prediction of this target can be expressed. Which is exactly what an output type is…

📐 Output types: how a prediction is expressed

Four ways of writing down the same predictive distribution One right-skewed predictive distribution shown four ways. Quantile output records the value at each probability level, with the median at the 0.5 quantile and the mean sitting to its right because the distribution is skewed. CDF output records the cumulative probability at or below a value. PMF output gives a probability per category. Sample output gives individual draws, where one index is a coherent trajectory across horizons. quantile · mean · median the distribution, and two point estimates 0.025 0.975 0.5 median mean cdf probability at or below a value 0.75 a value pmf probability of each category 0.06 lg dec 0.11 dec 0.27 stable 0.42 increase 0.14 lg inc sample draws from a joint distribution h=1 h=2 h=3 h=4
output_type output_type_id value
mean (none) mean of the predictive distribution
median (none) median of the predictive distribution
quantile a probability level, e.g. 0.75 the value at that quantile
cdf a possible value, e.g. 500 P(outcome ≤ 500)
pmf a possible category, e.g. "increase" P(outcome = "increase")
sample a sample index, e.g. "s3" one draw from the distribution

🎛️ …and how a hub configures them

"output_type": {
  "quantile": {
    "output_type_id": {
      "required": [0.01, 0.025, "...", 0.975, 0.99]
    },
    "is_required": true,
    "value": { "type": "double", "minimum": 0 }
  },
  "sample": {
    "output_type_id_params": {
      "compound_taskid_set": ["reference_date", "location", "target"],
      "min_samples_per_task": 100,
      "max_samples_per_task": 100
    },
    "is_required": false,
    "value": { "type": "integer", "minimum": 0 }
  }
}

🔍 Configured model output in the wild

Real FluSight rows from round 2026-01-10, national. task IDs · output type · value


reference_date  horizon  target                   target_end_date  location  output_type  output_type_id  value
2026-01-10      1        wk inc flu hosp          2026-01-17       US        quantile     0.01            18429
2026-01-10      1        wk inc flu hosp          2026-01-17       US        quantile     0.025           20177
2026-01-10      1        wk inc flu hosp          2026-01-17       US        quantile     0.05            21981
                                                                                          …                    
2026-01-10      1        wk inc flu hosp          2026-01-17       US        quantile     0.5             38936
                                                                                          …                    
2026-01-10      1        wk inc flu hosp          2026-01-17       US        quantile     0.975           61292
2026-01-10      1        wk inc flu hosp          2026-01-17       US        quantile     0.99            68125
2026-01-10      0        wk inc flu hosp          2026-01-10       US        sample       us_s1           36268
2026-01-10      1        wk inc flu hosp          2026-01-17       US        sample       us_s1           36397
2026-01-10      2        wk inc flu hosp          2026-01-24       US        sample       us_s1           33669
2026-01-10      3        wk inc flu hosp          2026-01-31       US        sample       us_s1           33727
2026-01-10      1        wk flu hosp rate change  2026-01-17       US        pmf          large_decrease  0.114
2026-01-10      1        wk flu hosp rate change  2026-01-17       US        pmf          decrease        0.244
2026-01-10      1        wk flu hosp rate change  2026-01-17       US        pmf          stable          0.158
2026-01-10      1        wk flu hosp rate change  2026-01-17       US        pmf          increase        0.231
2026-01-10      1        wk flu hosp rate change  2026-01-17       US        pmf          large_increase  0.253

🏷️ Hubs collect metadata about the models too

model-metadata-schema.json sets out what each team must document about their model

  • One file per model in model-metadata/, validated on every PR
  • The hubverse ships a schema template, hubs adapt it

Provenance for every prediction, and a natural basis for model cards.

team_name: "UMass-Amherst"
model_abbr: "flusion"
model_version: "1.1"
model_contributors:
  - name: "Evan Ray"
    affiliation: "UMass Amherst"
license: "CC-BY-4.0"
data_inputs: "NHSN, FluSurv-NET and ILINet."
methods: "Ensemble of statistical and machine
  learning time series models."
designated_model: true

Beyond the data standard

🔁 Automating everything we can

GitHub Actions do the operational work:

  • ✅ PR-level model output validation
  • ✅ Hub configuration validation
  • ☁️ Cloud hub data syncing
  • 📊 Dashboard builds

All actions live in hubverse-actions and install with hubCI::use_hub_github_action()

☁️ Cloud storage and access

Validated hub data is mirrored to a public S3 bucket

  • Opened directly as an Arrow dataset: no cloning, no full download
  • Query-able via 📦 hubData (R) and 📦 hubdata (Python)
  • Turns a hub into an open data resource, not just a repository

Enable it with a few lines in admin.json. The hubverse provisions the bucket.

📊 Dashboards & communication

  • Built with Quarto so easily customisable via Quarto configuration
  • Deployed as a fully static site, no backend required
  • Powered by JSON data prepared via GitHub workflows
  • Interactive UI built with client-side JavaScript (fast!)
  • New instances set up by copying/configuring the hub-dashboard-template
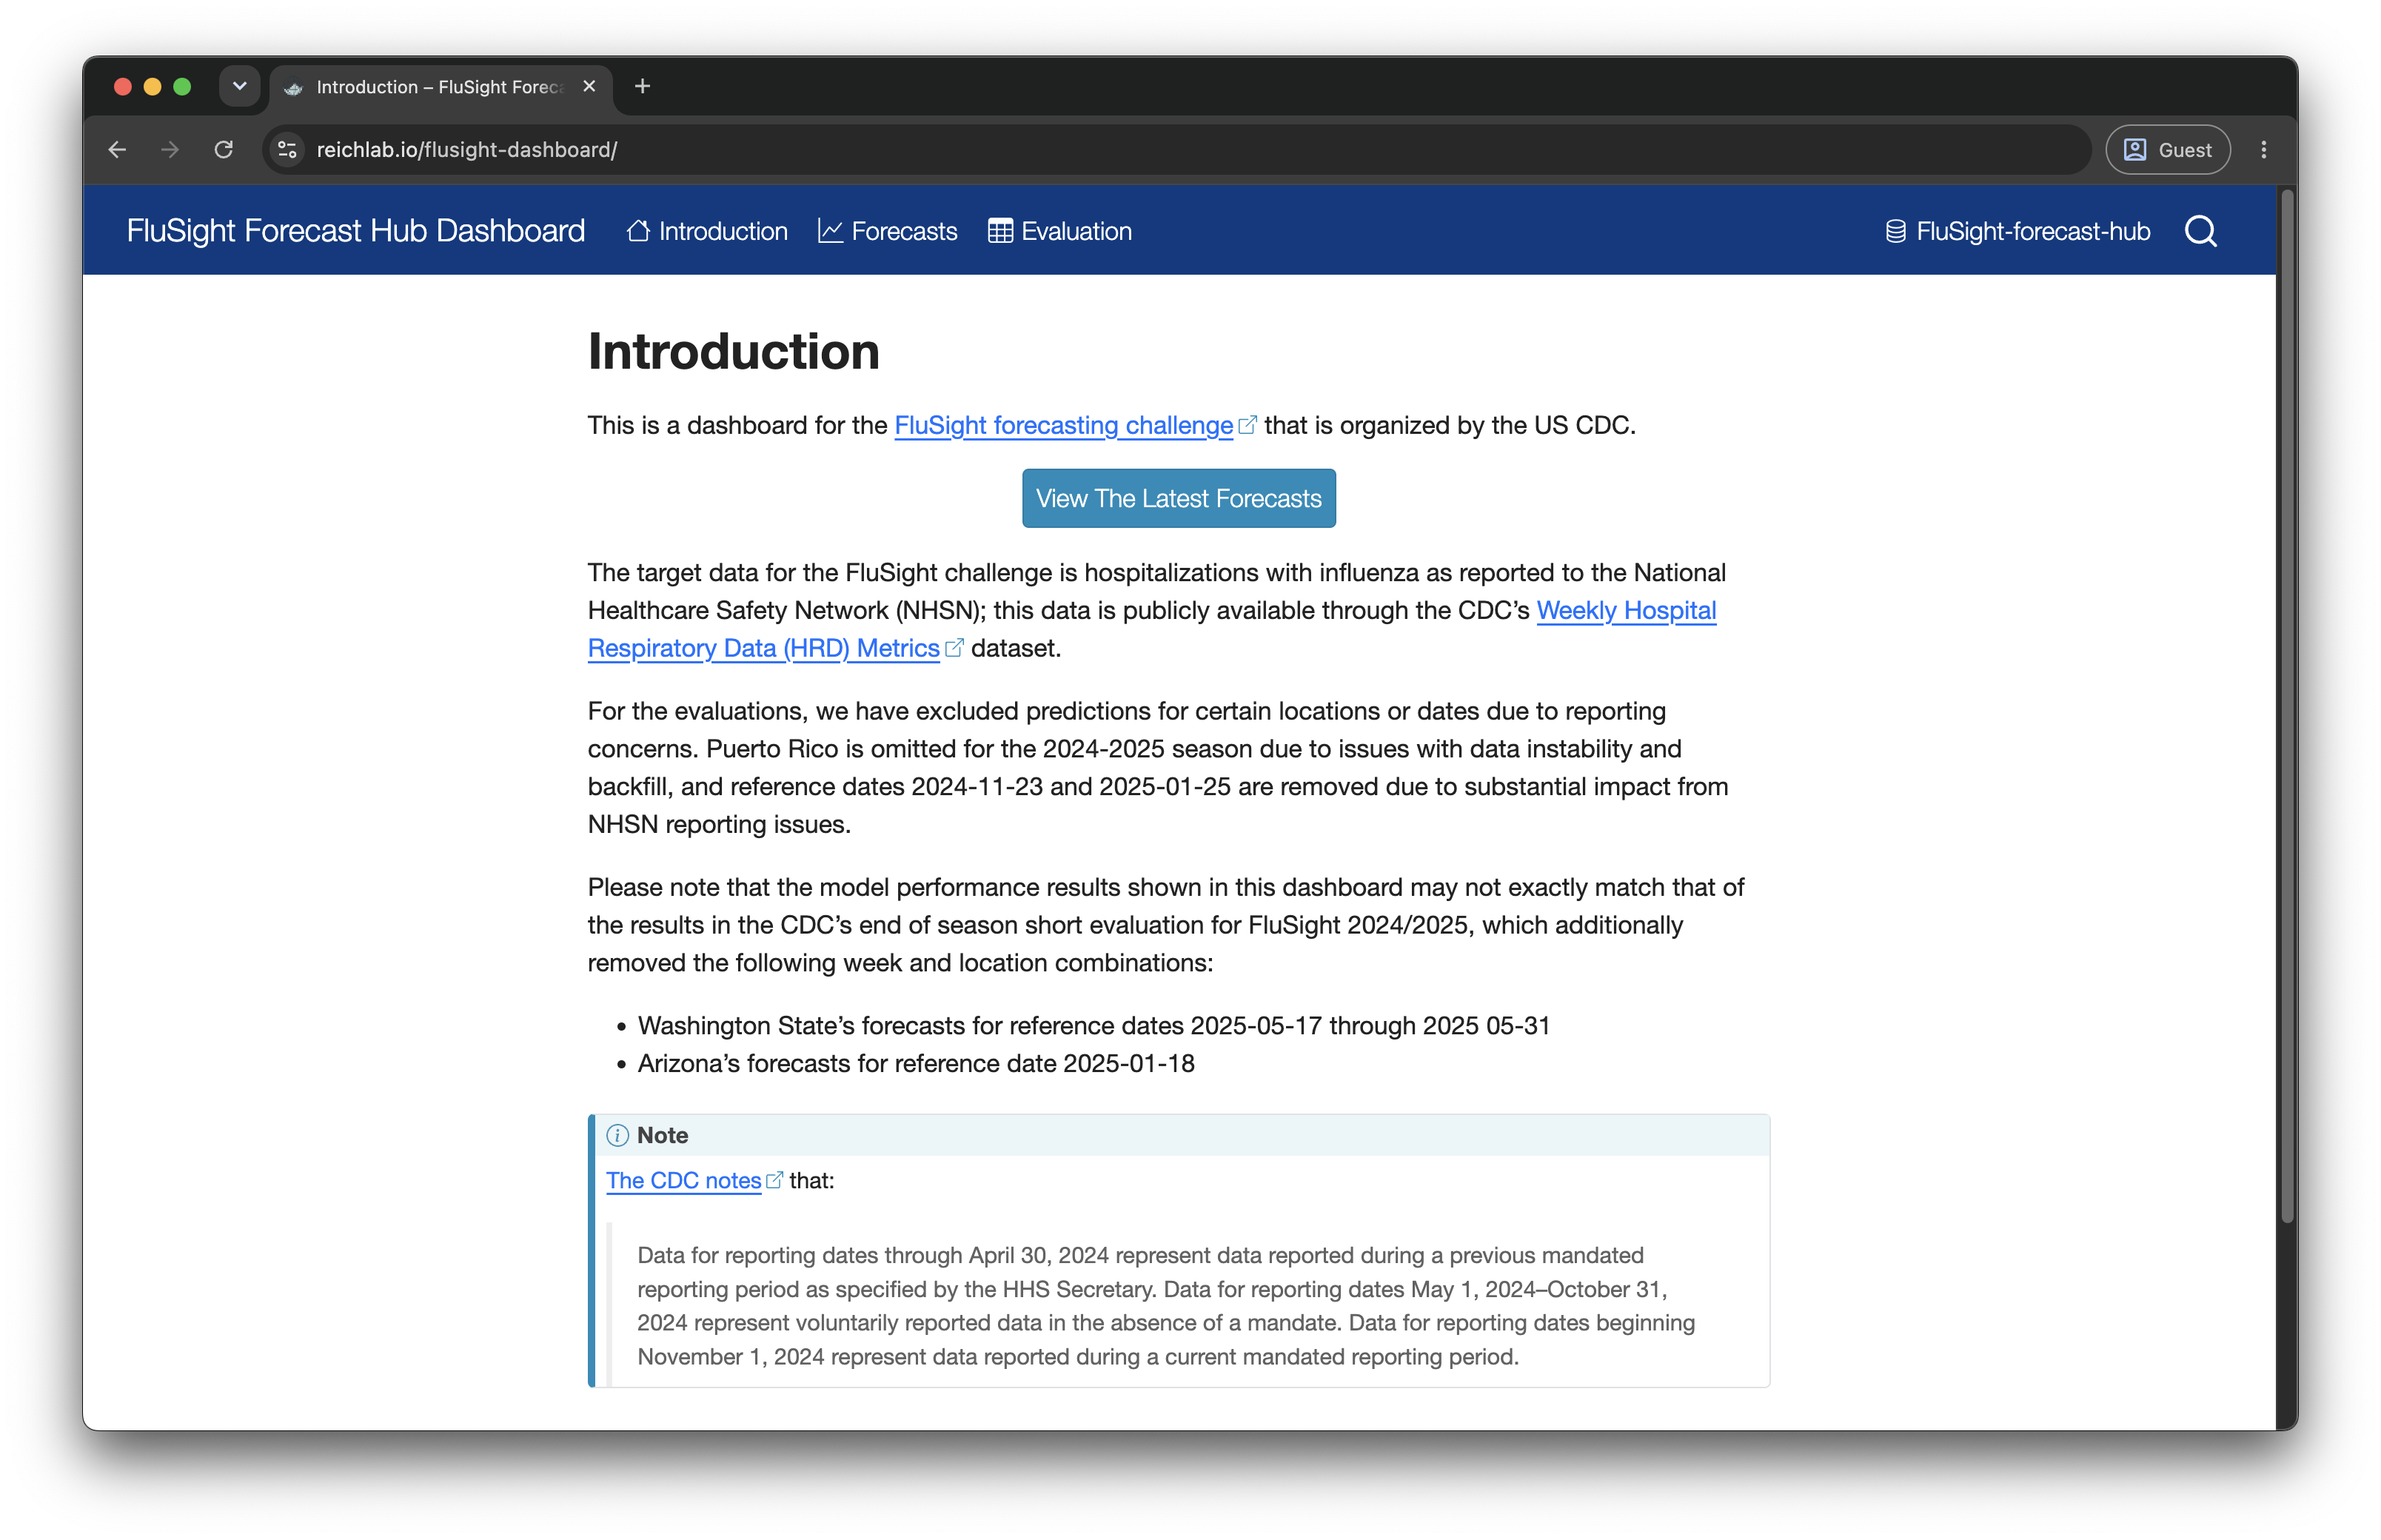
Screenshot of the FluSight Forecast Hub Dashboard introduction page, with Introduction, Forecasts and Evaluation tabs

👥 Hubverse roles and their tooling

Which hubverse tools serve which role A hub sits at the centre. Around it are four roles: hub administrators who configure it, modelers who submit model output, analysts who build ensembles, visualisations and evaluations, and stakeholders who consume the results. A panel on the right fills in the hubverse tools each role uses. The hub the hubverse one toolbox, every hub draws from it hub-config/ { } { } { } what to predict, and in what form target-data/ what actually happened Hub administrator designs and runs the hub FOR ADMINISTRATORS hubAdmin build & validate configs schemas · hubDocs the spec, and how to use it hubCI install GitHub Actions hubValidations customise validation model-output/ one folder per model Modeler mechanistic Modeler statistical Modeler machine learning model output in the hub standard FOR MODELERS hubValidations check before you submit hubData read the whole hub (R / Py) secondary analyses ensembles · visualisations · evaluations Analyst works across all the models at once FOR ANALYSTS hubData query without cloning hubVis plot model output hubEnsembles combine models hubEvals score against target data hub output dashboards · reports · briefings Stakeholders public health decision-makers FOR STAKEHOLDERS dashboard template static, no backend cloud mirror public S3, open data Hubverse developers & community build the tools · docs · schemas · outreach, openly and in the open

🦠 FluSight in operation

✅ Model output validation with hubValidations

Submitted by pull request, validated by GitHub Actions, reported back on the PR
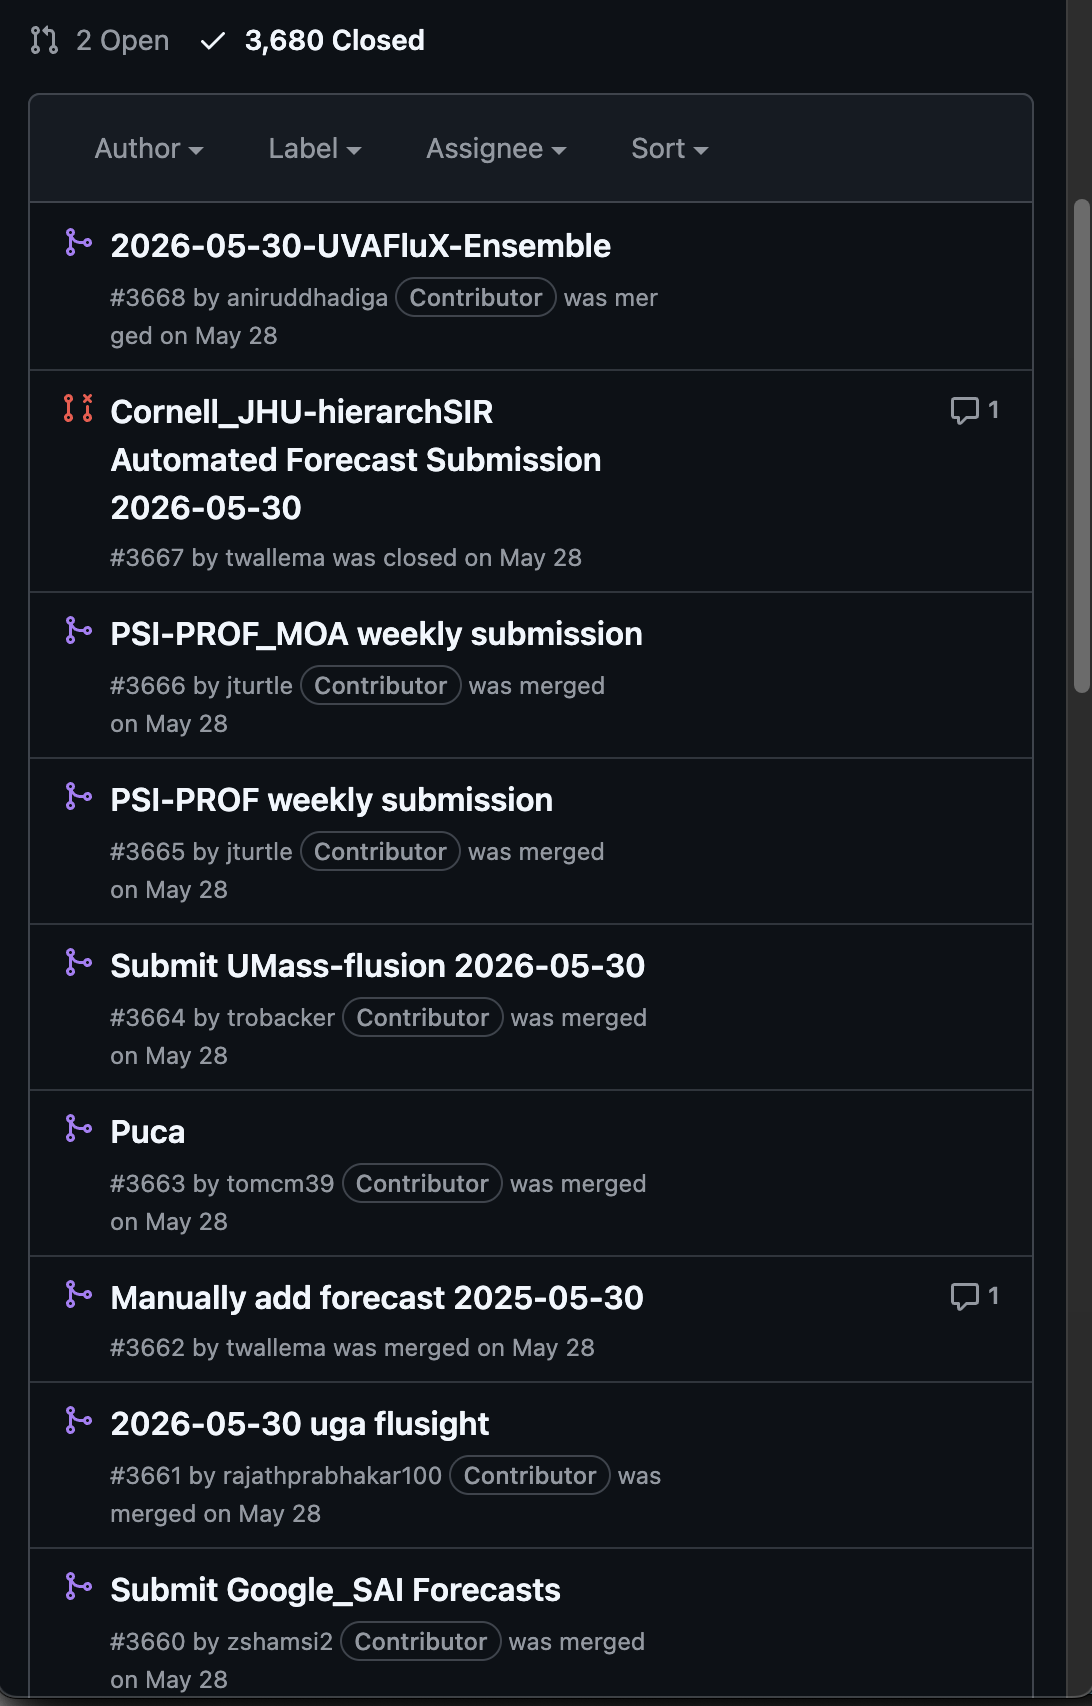
Screenshot of the FluSight hub pull request list: 2 open, 3,680 closed, with recent weekly model submissions from several teams

github-actionsbot commented
Submission validation
✅ All validation checks passed.
Check results
── hub-config ────
✔ [valid_config]: All hub config files are valid.

── team1-goodmodel/2022-10-29-team1-goodmodel.csv ────
✔ [file_name]: File name is valid.
✔ [file_location]: File directory name matches
  `model_id` metadata in file name.
✔ [file_format]: File is accepted hub format.
✔ [metadata_exists]: Metadata file exists.
✔ [colnames]: Column names are consistent with
  expected round task IDs and std column names.
✔ [col_types]: Column data types match hub schema.
✔ [req_vals]: Required task ID/output type/output
  type ID combinations all present.
… 18 further checks
Results for commit a1b2c3d
github-actionsbot commented
Submission validation
❌ Validation failed. The checks below did not pass. Push a new commit to the pull request to re-run them.
── hub-config ────
✔ [valid_config]: All hub config files are valid.

── team1-goodmodel/2022-10-22-team1-goodmodel.csv ────
✔ [file_name]: File name is valid.
✔ [metadata_exists]: Metadata file exists.
✖ [submission_time]: Submission time must be within
  accepted submission window for round. Current time
  "2026-08-12 18:55:10 UTC" is outside window
  2022-10-16 EDT--2022-10-23 23:59:59 EDT.
✔ [colnames]: Column names are consistent with
  expected round task IDs and std column names.
✔ [req_vals]: Required task ID/output type/output
  type ID combinations all present.
✔ [value_col_non_desc]: Quantile or cdf values
  increase when ordered by `output_type_id`.
… 21 further checks
Results for commit a1b2c3d

🔎 What actually gets checked

Standard checks, generated from tasks.json

  • 📄 File: name, location, format, submission window
  • 🧱 Structure: columns, types, duplicates, round ID
  • 🎯 Content: valid task ID combinations, required tasks present, values in bounds
  • 📐 Output-type specific: quantiles don’t cross, pmf sums to 1, sample counts
  • 🏷️ Model metadata and 🎯 target data: each with their own checks

Hub-specific checks in hub-config/validations.yml

default:
  validate_model_data:
    horizon_timediff:
      fn: "opt_check_tbl_horizon_timediff"
      pkg: "hubValidations"
      args:
        t0_colname: "reference_date"
        t1_colname: "target_end_date"
  • Opt-in checks shipped with hubValidations
  • Or the hub’s own R functions, in src/validations/R

create_custom_check() scaffolds a custom check: right structure, return classes and conventions, ready to fill in.

📂 Accessing model output via hubData

Connect to Arrow dataset of forecast submissions

library(hubData)

hub_path <- s3_bucket(
  "cdcepi-flusight-forecast-hub"
)
hub_con <- connect_hub(hub_path)
hub_con
hub_connection
9 columns
reference_date: date32[day]
target: string
horizon: int32
target_end_date: date32[day]
location: string
output_type: string
output_type_id: string
value: double
model_id: string

Query and collect data

# Filter for one model and forecast date using dplyr
library(dplyr)
hub_con |>
  filter(
    model_id == "CADPH-FluCAT_Ensemble",
    target_end_date == "2023-10-28"
  ) |>
  collect_hub()
# A tibble: 92 × 9
  model_id    reference_date target horizon target_end_date location output_type
* <chr>       <date>         <chr>    <int> <date>          <chr>    <chr>      
1 CADPH-FluC… 2023-10-14     wk in…       2 2023-10-28      06       quantile   
2 CADPH-FluC… 2023-10-14     wk in…       2 2023-10-28      06       quantile   
3 CADPH-FluC… 2023-10-14     wk in…       2 2023-10-28      06       quantile   
4 CADPH-FluC… 2023-10-14     wk in…       2 2023-10-28      06       quantile   
5 CADPH-FluC… 2023-10-14     wk in…       2 2023-10-28      06       quantile   
# ℹ 87 more rows
# ℹ 2 more variables: output_type_id <chr>, value <dbl>

See more in Accessing data vignette.

Python analogue hub-data also available.

🌐 Ensembling with hubEnsembles

Combine models using simple or weighted rules

forecast_df <- hub_con |>
  filter(
    model_id %in%
      c(
        "CADPH-FluCAT_Ensemble",
        "CEPH-Rtrend_fluH",
        "CFA_Pyrenew-Pyrenew_HE_Flu"
      ),
    output_type == "quantile"
  ) |>
  collect_hub()


hubEnsembles::simple_ensemble(
  forecast_df,
  agg_fun = median,
  model_id = "simple-ensemble-median"
)
# A tibble: 492,476 × 9
  model_id    reference_date target horizon target_end_date location output_type
* <chr>       <date>         <chr>    <int> <date>          <chr>    <chr>      
1 simple-ens… 2023-10-14     wk in…      -1 2023-10-07      01       quantile   
2 simple-ens… 2023-10-14     wk in…      -1 2023-10-07      01       quantile   
3 simple-ens… 2023-10-14     wk in…      -1 2023-10-07      01       quantile   
4 simple-ens… 2023-10-14     wk in…      -1 2023-10-07      01       quantile   
5 simple-ens… 2023-10-14     wk in…      -1 2023-10-07      01       quantile   
# ℹ 492,471 more rows
# ℹ 2 more variables: output_type_id <chr>, value <dbl>

📈 Dashboard - forecasts

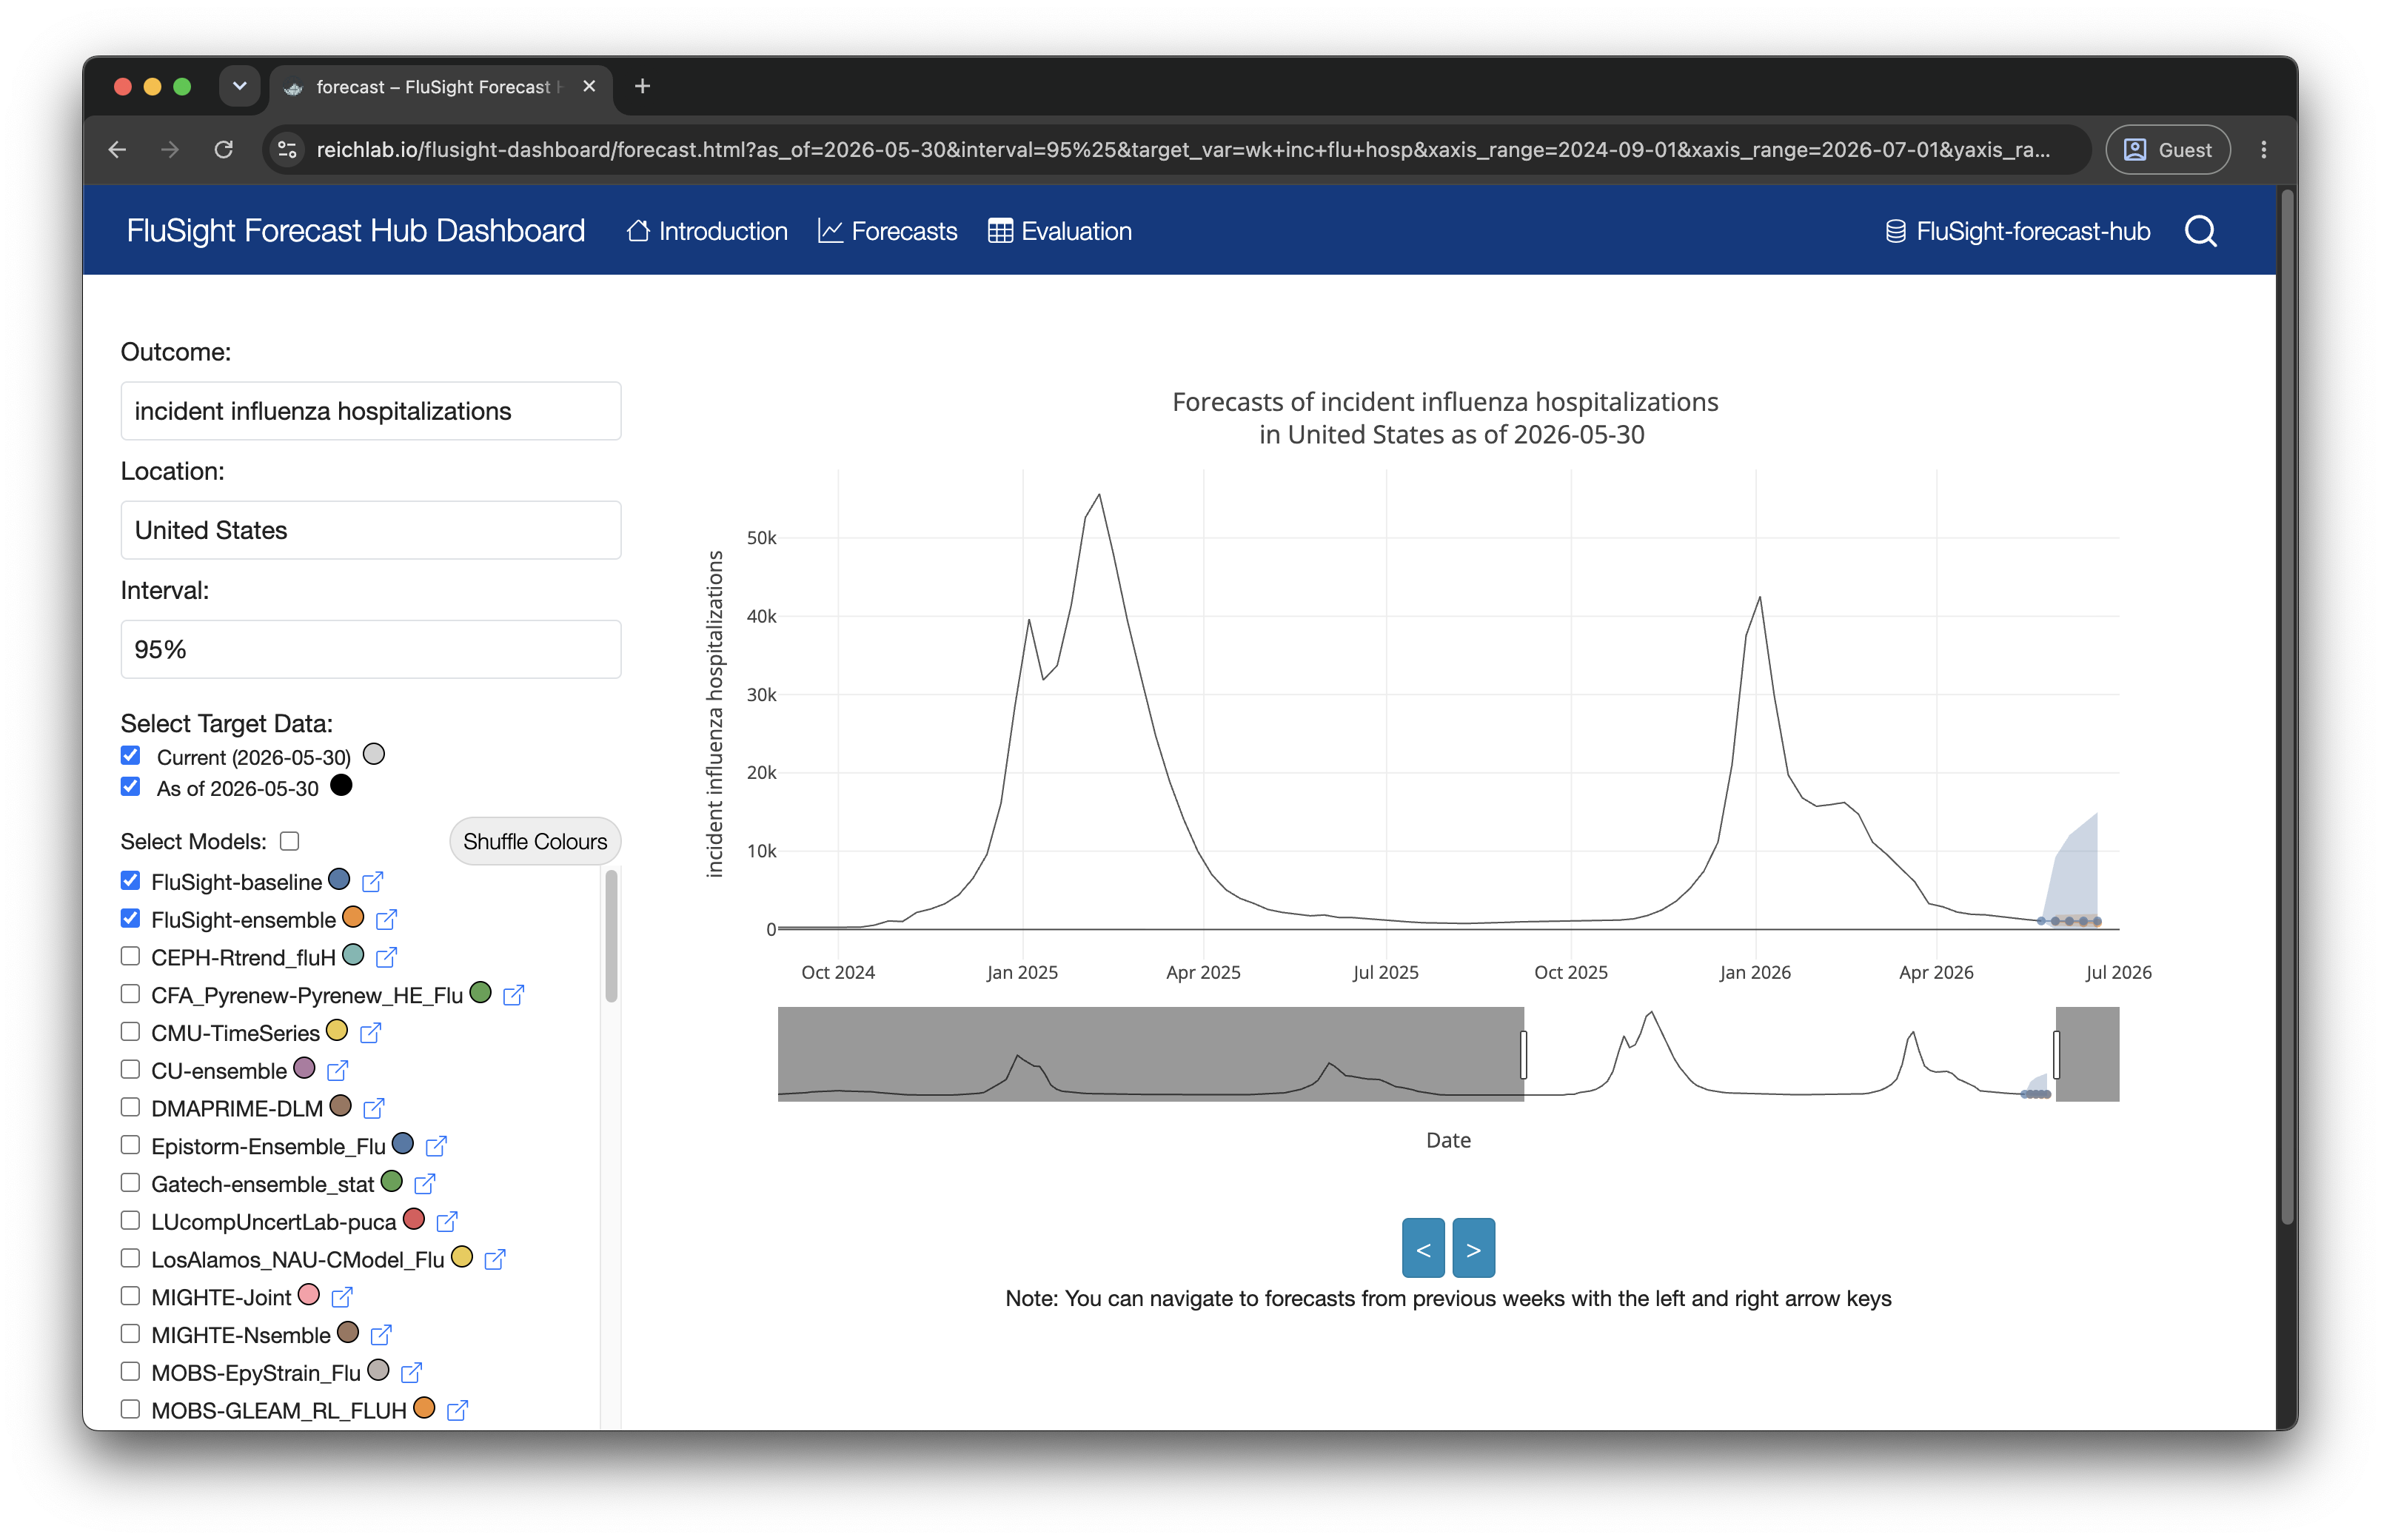
Screenshot of the FluSight dashboard forecast page: controls for outcome, location, interval and model selection on the left, and a time series of incident influenza hospitalizations in the United States with a forecast fan at the right hand end

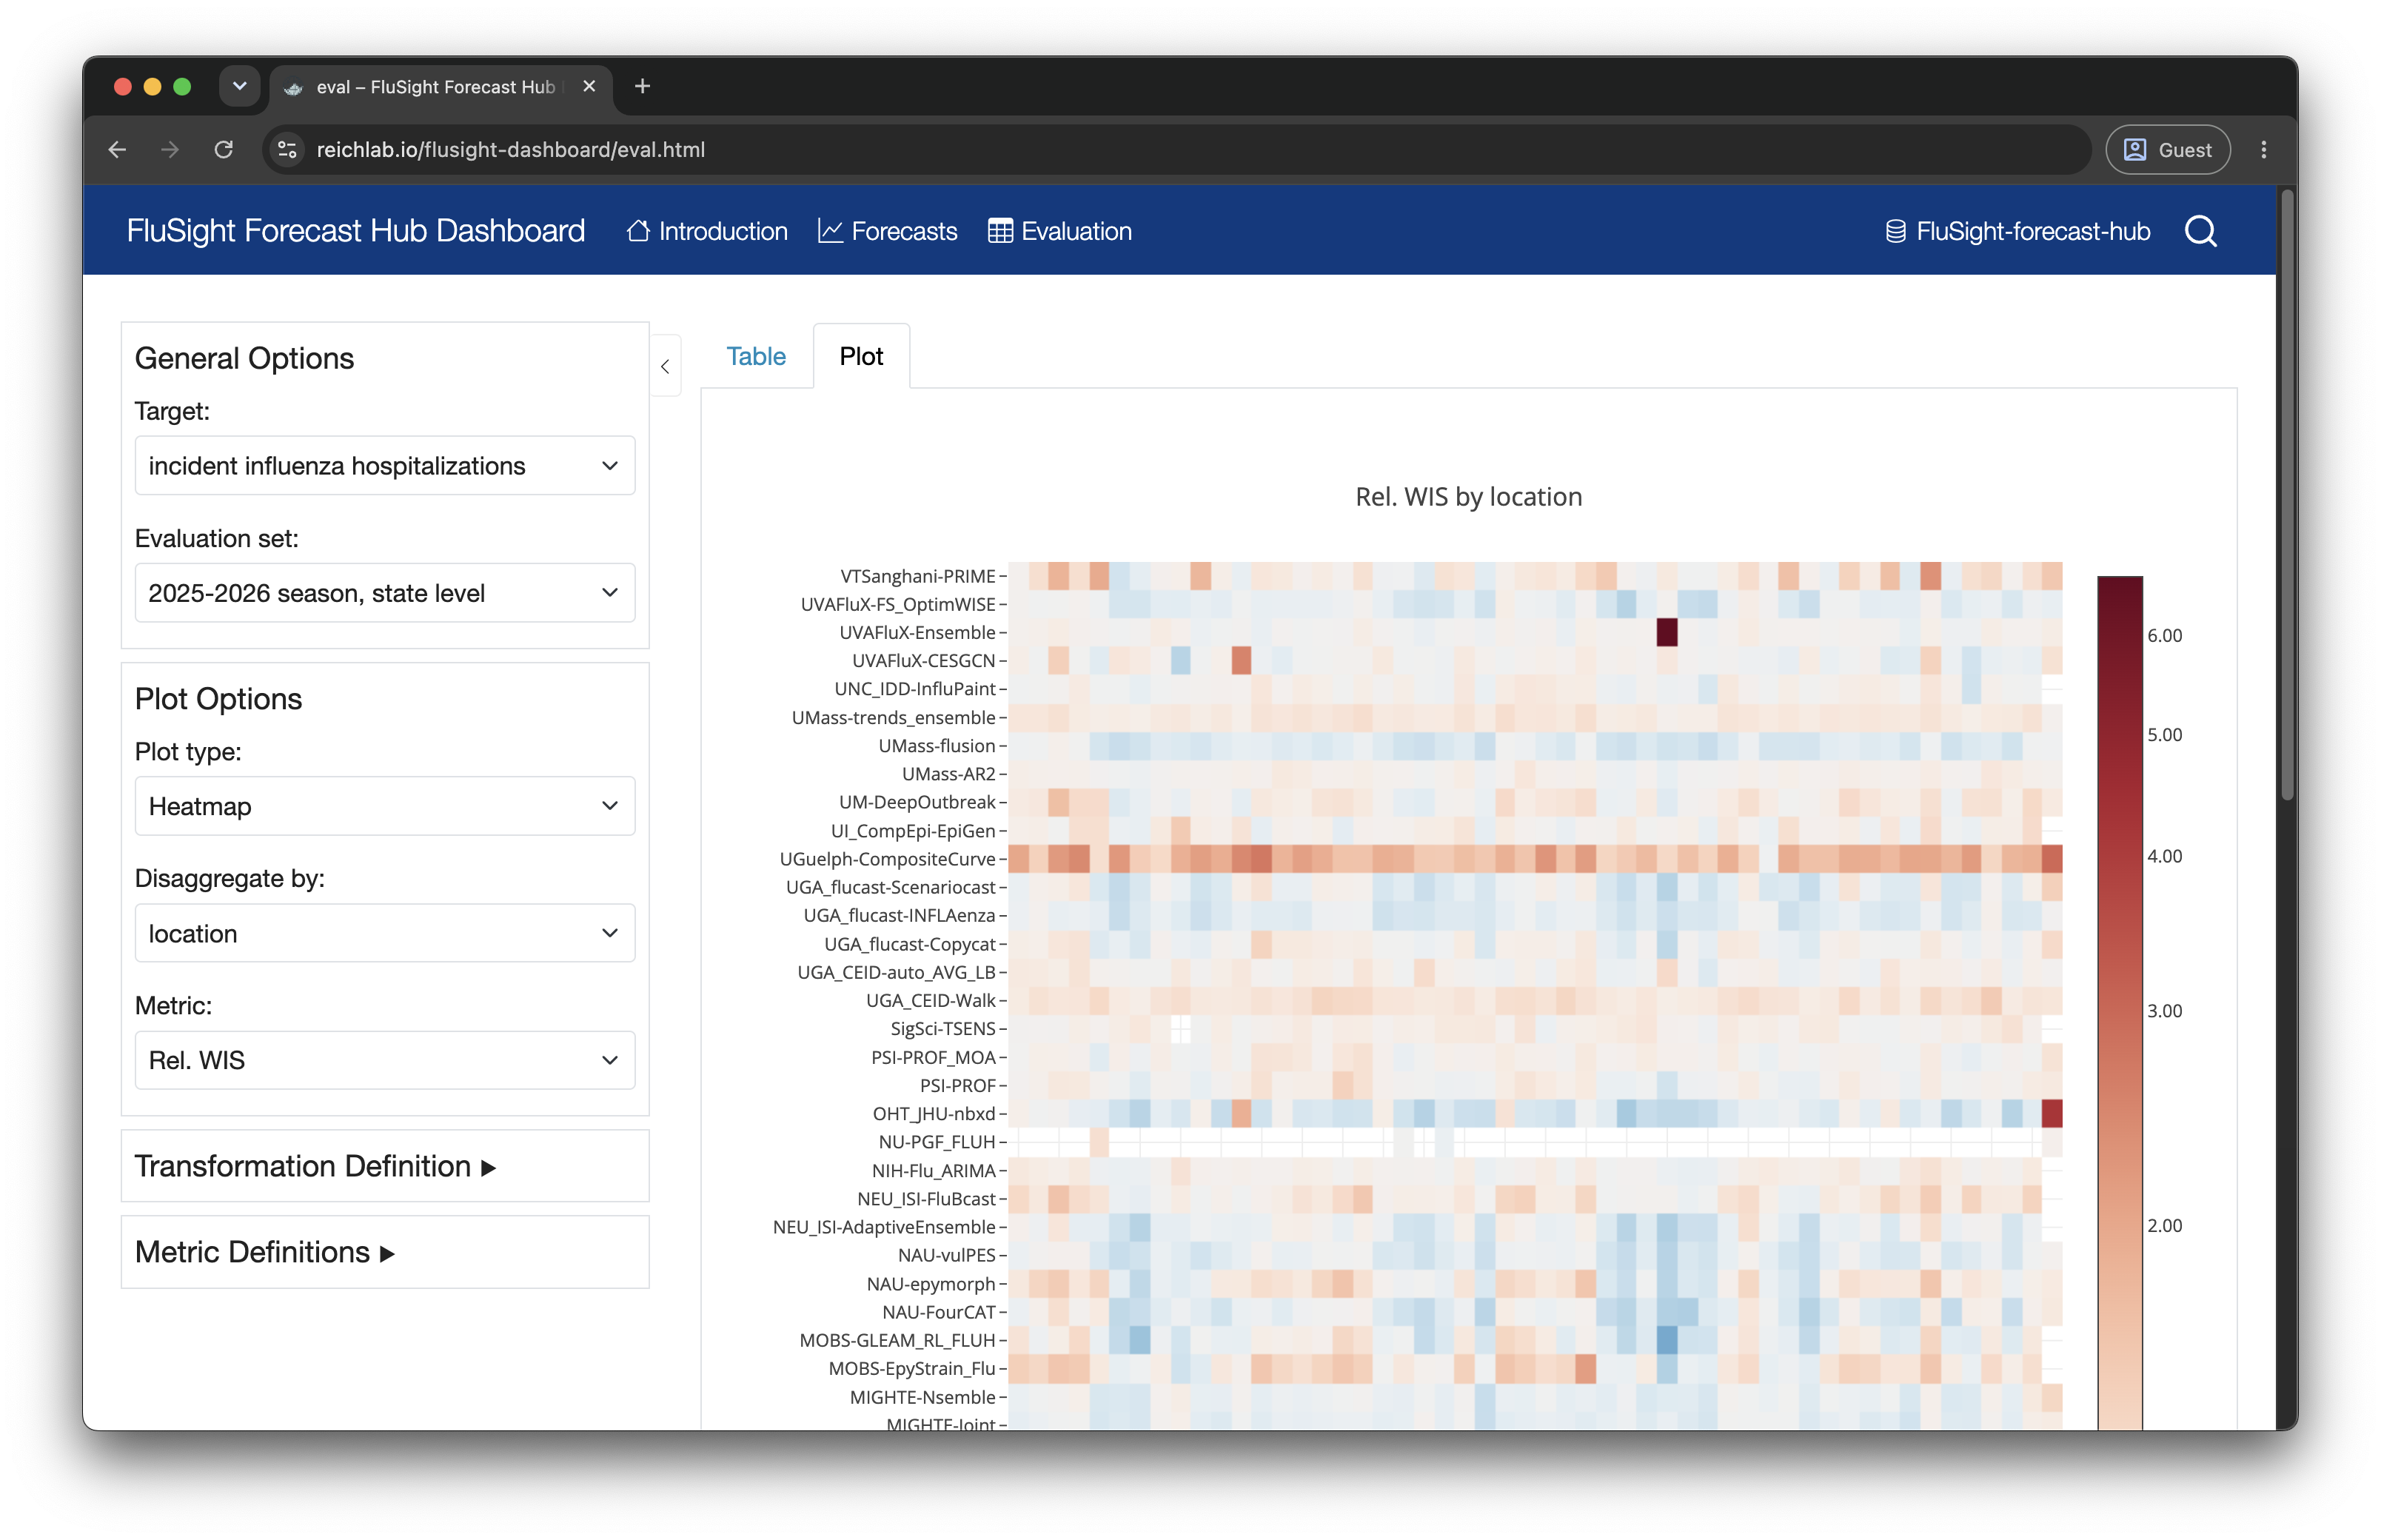
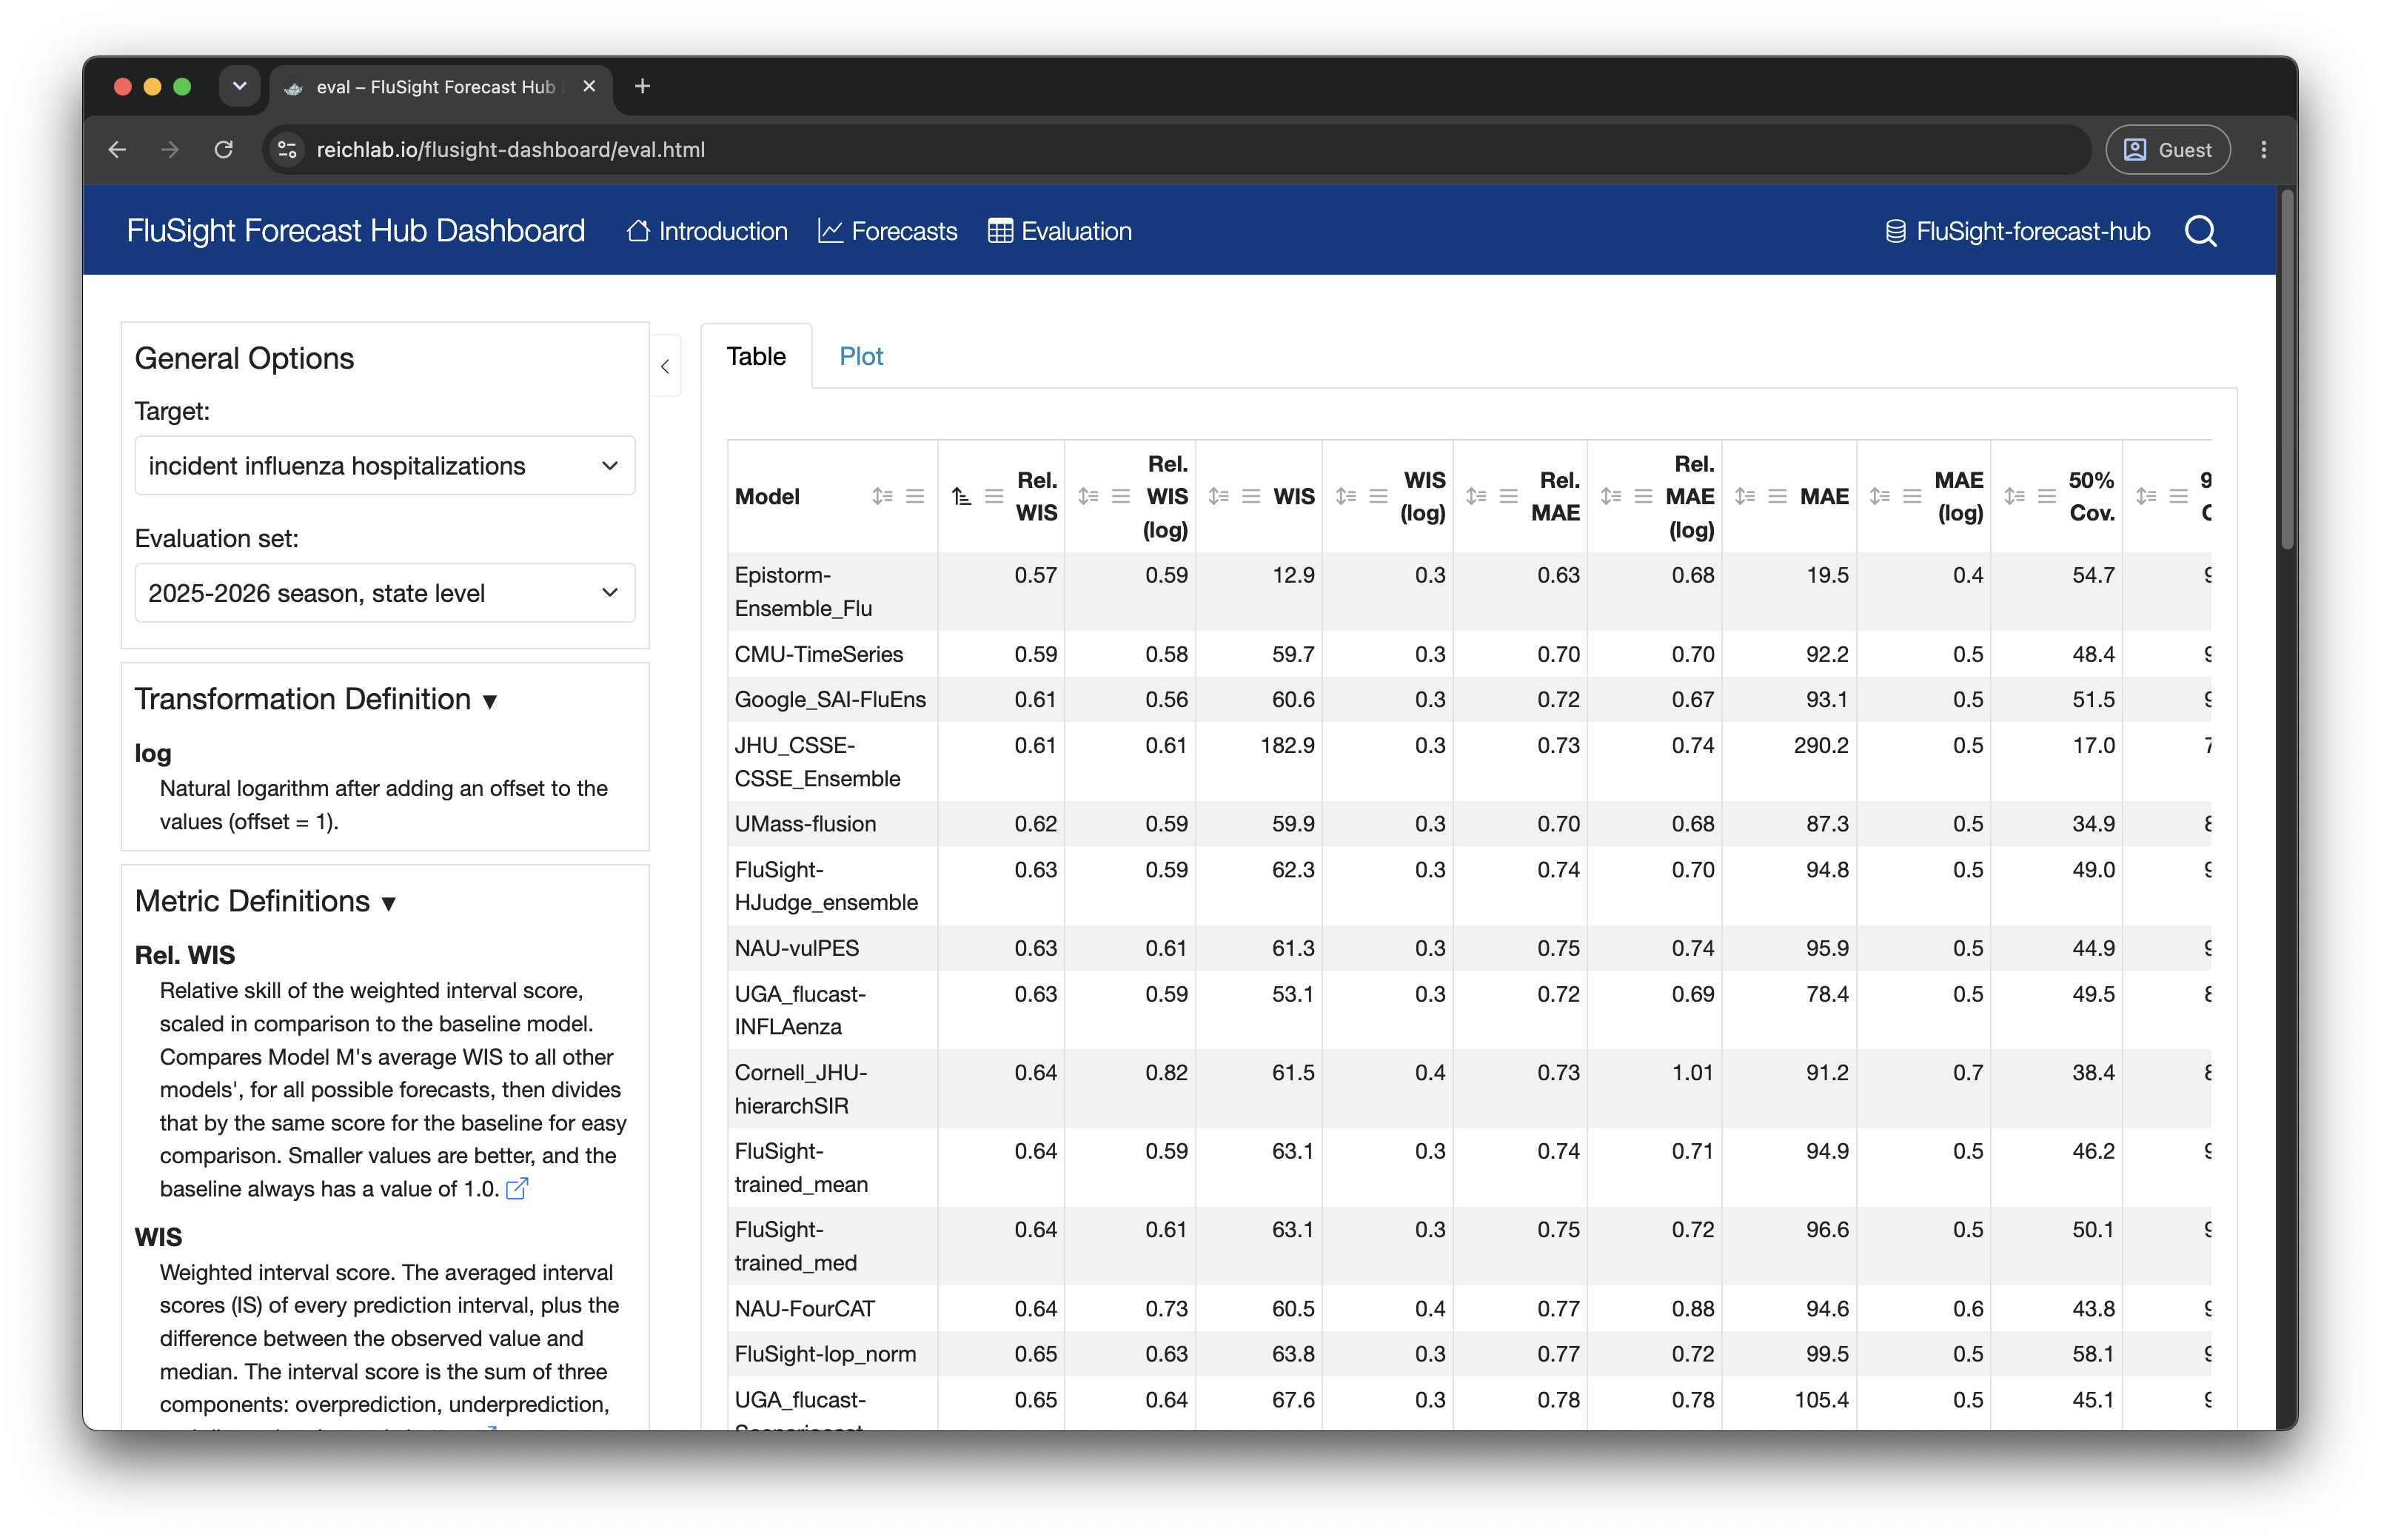
🩺 Dashboard - model evaluations

Evaluates forecasts against target (observed) data.
Closing remarks

🪩 Who’s using it

34 hubs across 15 organizations, on five continents

736 models · 4.6 billion rows of model output (Sep 2026)

Five kinds of hub:

  • 🌍 Community: open, public repos
  • 🔒 Collaborative, private: e.g. Paraguay, Australia–Aotearoa
  • 🧪 Local / model development: a hub on your own laptop
  • 🎓 Training: teaching hubs
  • 🗄️ Archival: retired hubs, kept queryable

💡 Lessons & wider relevance

  • 📐 A good standard is leverage: define the interface once, reuse everything downstream
  • ✅ Standards + automation reduce friction
  • ⚙️ Configuration over code: versioned schemas let the standard evolve without breaking hubs
  • 🧰 Open source keeps it free & accessible
  • 🌍 Standardised, open data fuels downstream use: teaching, reproducible research, and teams’ own model development

Built on hubverse data

SISMID

Short course teaching real-world outbreak forecast evaluation, worked directly on hub data

RespiLens

A responsive web app to visualise US respiratory disease forecasts, built for state health departments and the public. ACCIDDA, UNC Chapel Hill

MicroHub workshop

Hands-on workshop: run forecast models locally in a Docker app, then stand up your own hubverse hub on GitHub. Northern Arizona University

🙏 Thank you!

Group photo of eleven members of the hubverse team standing on the steps of a building

Members of hubverse team at the 2024 work retreat, UMass Amherst

Tip

Interested in getting involved? Check out our Getting Involved page!

📄 Read more

Consortium of Infectious Disease Modeling Hubs et al. (2026)
A software platform for collaborative infectious disease modelling
Nature Health

https://doi.org/10.1038/s44360-026-00145-7

Open-access preprint:
https://doi.org/10.1101/2025.10.03.25337284